Coronavirus: Understanding Exponential Growth
In the past few weeks there has been a lot of discussion about the coronavirus which has focused on its exponential growth. Accompanying these discussions, there are always graphs illustrating why exponential growth of infectious diseases is bad. However, these graphs can be misleading if you don’t really grasp one important aspect of exponential growth: the exponential behavior exists from day 1.
Basic Review
First, let’s revisit exponents. If you are given an expression like $x^y$, then that means you multiple the base $x$ times itself $y$ times. For instance, $2^4$ is equal to $2 \times 2 \times 2 \times 2$ which gives us the value $16$.
When we are discussing exponential growth of an infectious disease, we are discussing a disease which spreads in such a manner that it can be modeled using exponents.
For instance, if a disease doubles every day, we can estimate the number of cases on day $4$ by calculating $2^4=16$ (we use a base of $2$, since we expect it to double). Similarly, on day $10$, we would expect $2^{10}=1024$ cases.
Note: This is a hypothetical model and is not intended to represent the coronavirus which seems to double every $3$-$5$ days instead of every day.
Hockey Sticks
If we graph exponential growth, we always end up with graphs looking more or less like this:
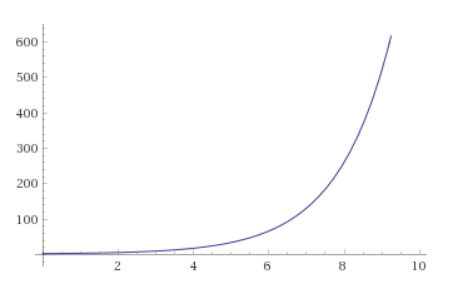
People will sometimes refer to such graphs as “hockey stick” graphs, since they often have a long, seemingly non-increasing, flat portion, followed by a drastic increase which curves up like a hockey stick.
This apparent “hockey stick” behavior is precisely why exponential growth of an infectious disease is alarming: it clearly illustrates the way in which the disease can seemingly become completely out of control overnight!
However, this is also very misleading in both positive and negative ways.
Hockey Sticks All The Way Down
The reason why such a graph is misleading, is because it hides the fact that the growth does not fundamentally change behavior at any point. The “hockey stick” behavior exists from the very beginning. For instance, look at the graph above, which models the first ten days of a disease which doubles every day. Now, look at the following graph which models the same disease, but from day $100$ to day $110$:
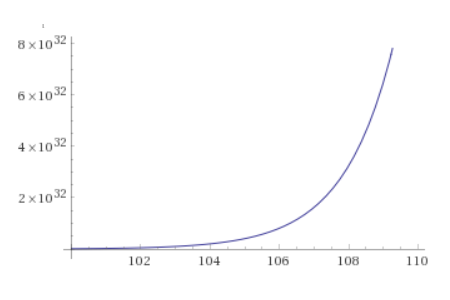
If we only consider the shape of the curve, we see that it’s the exact same graph as before! In other words, you might look at the first graph and say, “things will be ok if we solve the problem before day 6,” but then we look at the second graph and see that everything is “flat” until day $106$, so that’s when we have to actually solve the problem by!
This is why it is difficult for most people to properly understand exponential growth: exponential growth always looks more or less like a hockey stick no matter what time period you are looking at, because it is always getting significantly worse. For any exponential model, every ten day period will have the exact same curve.
In other words, the “out of control” growth by day $10$ seems to disappear when looking at a graph of later days, because the later days are so much worse, that the previous “out of control” values are inconsequential in comparison.
This can be seen even more clearly if we look at the model from day $0$ to day $110$
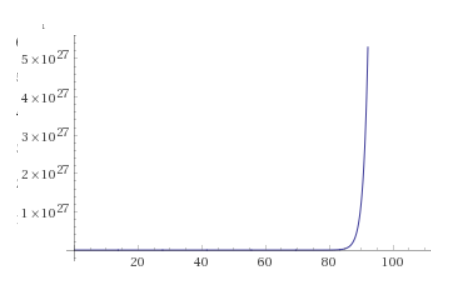
We get a different curve, because we are looking at more than $10$ days, but we see very clearly how the “out of control” $10$ day growth completely disappears.
Going further, if we look at $200$ days, we see that even the above growth is nothing compared to the end of the hockey stick:
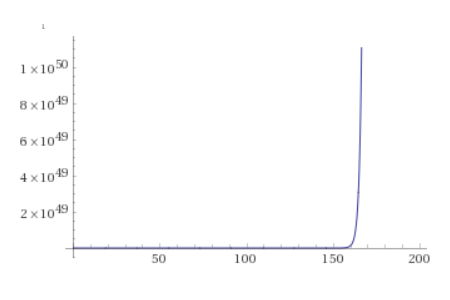
More succinctly: exponential growth is bad, because it is always getting significantly worse.
What Does This Mean In Practice
In practice, this means that people are likely to make two possible mistakes.
-
Many will look at a model of the growth of coronavirus and decide that we still have time to solve the problem before growth gets out of control. This is wrong, because, by definition, it’s always getting out of control.
-
Others will see such models and decide it is too late to do anything and we are all doomed. This is wrong (at this point at least!), because actions we take to stop the progress of the spread now will prevent even more exponential growth. In other words, every person we prevent from getting the disease will prevent an exponential number of other people from getting it.
The takeaway for all of us is the following: in some sense, we are always too late to avoid being on the bad end of the hockey stick, but also always at the best time to prevent further spread and ending up on the bad end of an even larger hockey stick.